Special offers for Seatmap.pro clients
After a long and tedious period of recovering from COVID-19 pandemic, ticketing industry is back on track and so is Seatmap.pro. We mark this event with special offers for our new clients.
Seatmap.pro is describing the anatomy of seating plans – the core consisting of three main data layers that are be used to render schemas.
After describing the methods of rendering in the previous article, we are moving onto the seating plans themselves and what they consist of.
The seating plan of a taken venue comprises of three main data layers:
Here at Seatmap.pro, we do not use SVG to render the full schema, the seat data and graphic elements are stored separately – this is a great approach when it comes to storing cache.
Talking about the process as such, we first render the graphics, then the data on prices and availability, then the seats themselves.
Now, let’s get into the details of each data layer and how we work with them.
Metadata can be transferred via various SRS/GoS notations – it all depends on the system. The schema as such is an array of seats presented either as a flat list or as spatial disposition. Each taken seat will either be similar to the ones close to it or have a distinct difference. We are transferring the lists with flatline disposition, where the seats have their IDs and coordinates.
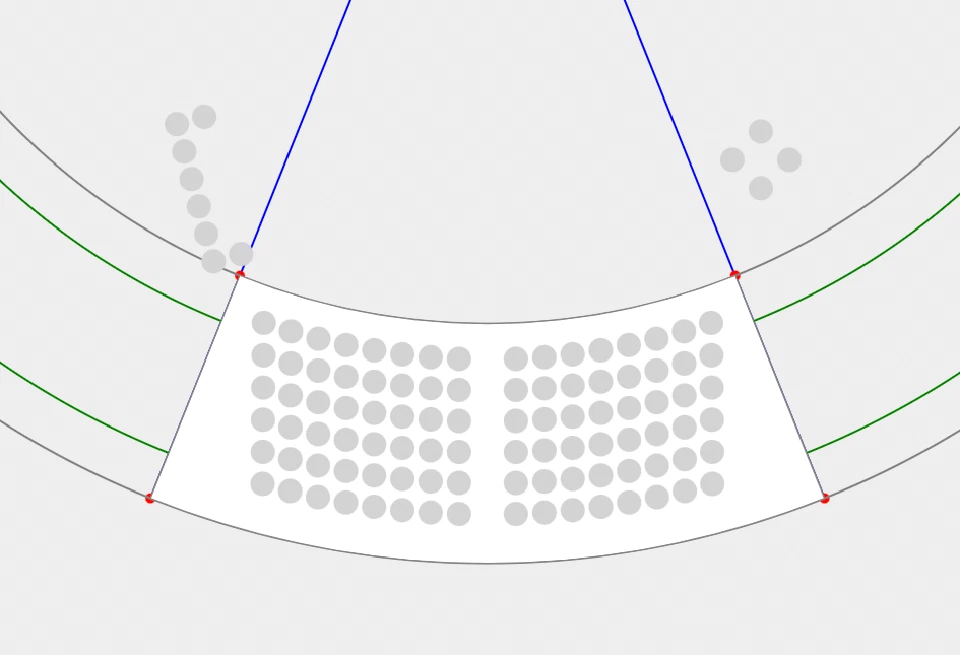
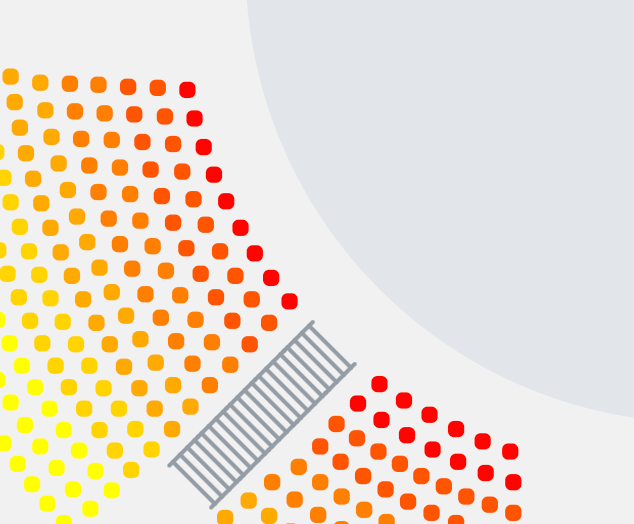
The ticketing systems are allowing the selling function to work with single units, meaning that every seat exists uniquely. This is exactly why the ticket sellers need the systems tailored to their needs – the use of common e-commerce solutions is often irrelevant for their purposes. However, the visuals of seat distribution are quite standard – taken as an example, Seatmap.pro uses coloured circles for showing the seats schematically. Circles are much more versatile than other forms (as you can see on the example below), as they do not have the issues of showing the angles of seats compared to the stage of the pitch space.
 Here you can see the example of squares used for indicating the seats – it is quite obvious that the angle chosen looks quite strange compared to the stage space.
The use of non-standard forma can lead to an array of issues, such as inability to understand the venue or disposition.
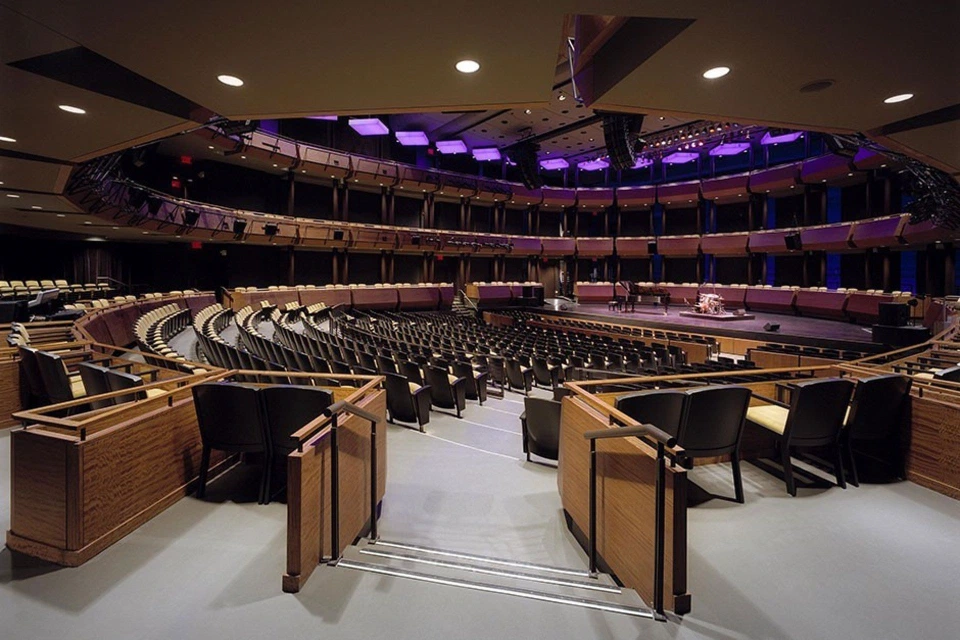
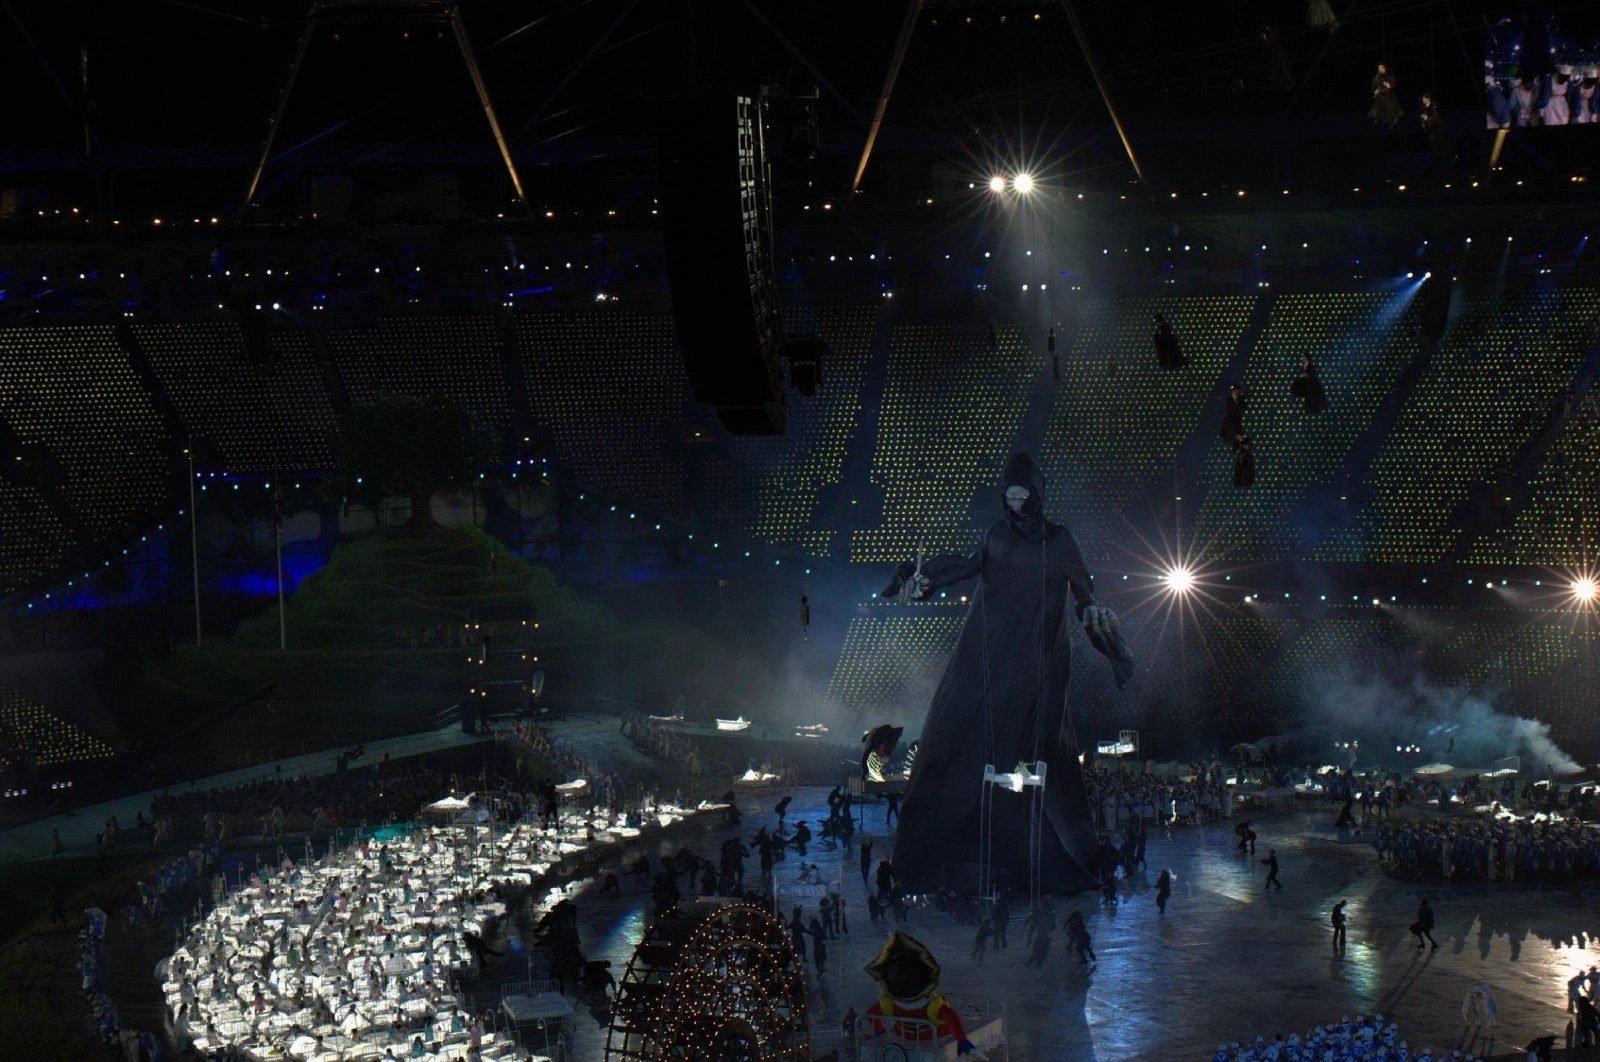
 Here is another example of a venue where it is virtually impossible to understand where the stage is at all.
To minimize the traffic volume, we are only transmitting the data on available seats. Each seat that we process may have the properties attribute that can be used for a variety of cases in rendering. Properties can contain any kind of JSON object, which is pretty useful to build logic on top – for instance, the inability to leave orphaned seats (single seats) or the seats protected by a password. Seatmap.pro allows managing the seat images and uses sprites (2D images used together with some data to position it in a larger world) to display the data.

Seatmap.pro team utilizes SVG standards without the use of self-made dedicated libraries. Taking from the heights of our own experience, creating a special format is not necessary in not necessary in this case. SVG functions fully cover the needs of working with the seating schema graphics, including the interactive parts in General Admission sections. To bind the graphic elements with the metadata, we use data attributes in SVG tags. For instance:
<g class="sector" data-name="FAN" data-id="2681664">
    <g transform="matrix(1 0 0 1 1180 -180)" id="355181aa-d1c9-475a-8b48-18bec654c38d" data-gos-id="2681664">
        <rect class="sm-shape-ga" x="-125" y="-125" rx="8" width="250" height="250" />
    </g>
</g>
Seatmap.pro is here to talk from the experience – the use of these three layers is enough to transfer the information on the event venue between ticket sellers and use this notation for GoS on all the APIs.
After a long and tedious period of recovering from COVID-19 pandemic, ticketing industry is back on track and so is Seatmap.pro. We mark this event with special offers for our new clients.
Seatmap.pro breaks down the methods of seating plan rendering: HTML Tags, SVG, HTML Canvas and WebGL. Pros, cons and our own expert choices – everything to help in making the right choice.
Seatmap.pro team has struggled with the common problem of those developing ticketing systems. Having found the solution, we are presenting GoS – the seating data storage model allowing to form a new, convenient industry standard.